Overview
The Pricing & Revenue Management department (PRM) kick-started a rebuild of its internal data analysis tool as a cloud-based web application. As a frontend developer focused on UI/UX, I worked on translating the legacy interface into a modern, accessible web experience.
Goal
The department suffers from legacy tooling and an outdated development environment. This legacy environment slows down development cycles and creates friction for the teams.
The challenge lies in translating the concept of legacy data tools into a modern web-based application while still providing a familiar experience to current users.
Process
The department set the budget for a cloud platform and a project team consisting of a product owner, a software engineer, a full-stack developer, a business analyst, and a frontend developer.
The project kicked off with a debrief from the product owner, who explained the preparation necessary before development. Within the project, we worked using the ScrumBan method. I took on the role of frontend developer with focus on UI and UX.
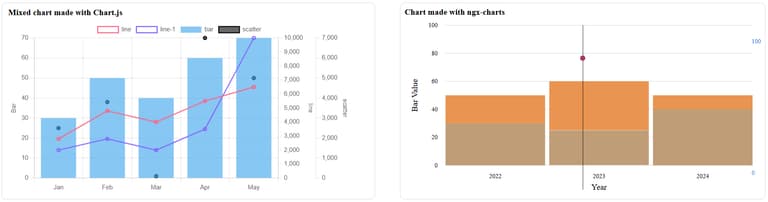
My first responsibility was to research several JavaScript chart libraries that the team would use to visualize data. I took one sprint to research, create prototype dashboards, track visual appeal, usability, and ease of implementation. I presented a comparison of libraries against business and development requirements.
After I advised on a library and we made our decision, I started mocking up the wireframe and dashboard design. The software engineer provided several technical constraints, such as the company standards for frontend frameworks and design systems. This meant designing within the constraints of company standards. For example, the company has its own design system, which I used as a basis to express my UI & UX.
From there, we started developing, refining user stories, and workshopping the various business wishes and needs in an agile way till the MVP was reached, which will be presented to the upper management team for approval.
Results
The outcome of this project is an MVP web-based data analysis application. Other PRM colleagues will further develop the application until the legacy tools can be phased out.
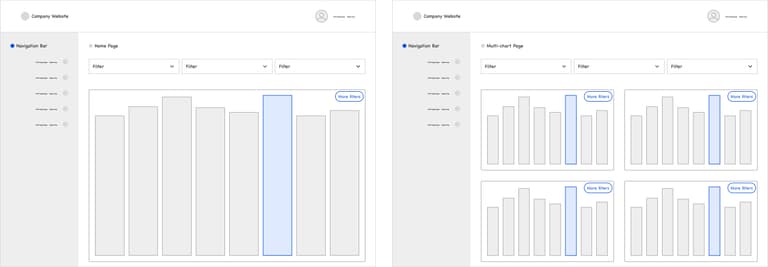
My contribution is a maintainable user interface that is able to visualize the familiar graph views. I also introduced a new feature that provides a multigraph view. This concept improves the user experience by allowing users to broaden their data views and capabilities. This enables faster insights and more efficient analysis.
The multigraph view became a highly desired feature, since it did not exist in the legacy tooling. This functionality helps analysts and managers in making better decisions and provides more opportunities for insight. Another impact of the design and technology decisions is a more modern and robust code base that provides a more stable development environment.
Reflection
This was an exciting project, working in a fast-paced and multidisciplinary team. I learned a lot of new technologies from both frontend and backend, as I had to use unfamiliar frameworks and work with cloud platforms. The biggest learning point was to work in a tightly constrained project environment, making it challenging to make decisions and express designs.
Something new for me to work with was using a company design system and understanding predefined tokens, rules, and patterns that I have to use to express the user’s wishes and needs for a graphical user interface. The benefit of using an organization’s design system is that familiarity is almost guaranteed, as other company software and teams also use this.
I was able to provide my expertise on UI and UX, but next time I hope to involve the business users more by hosting generative sessions and workshops to get closer to the desired UI and UX. Although due to project constraints and budget, I wasn’t allowed to do so. Also, providing more mockups and contacting official design teams and channels would’ve made the ideas and concept more convincing and clearer.